map

Maps of Dune

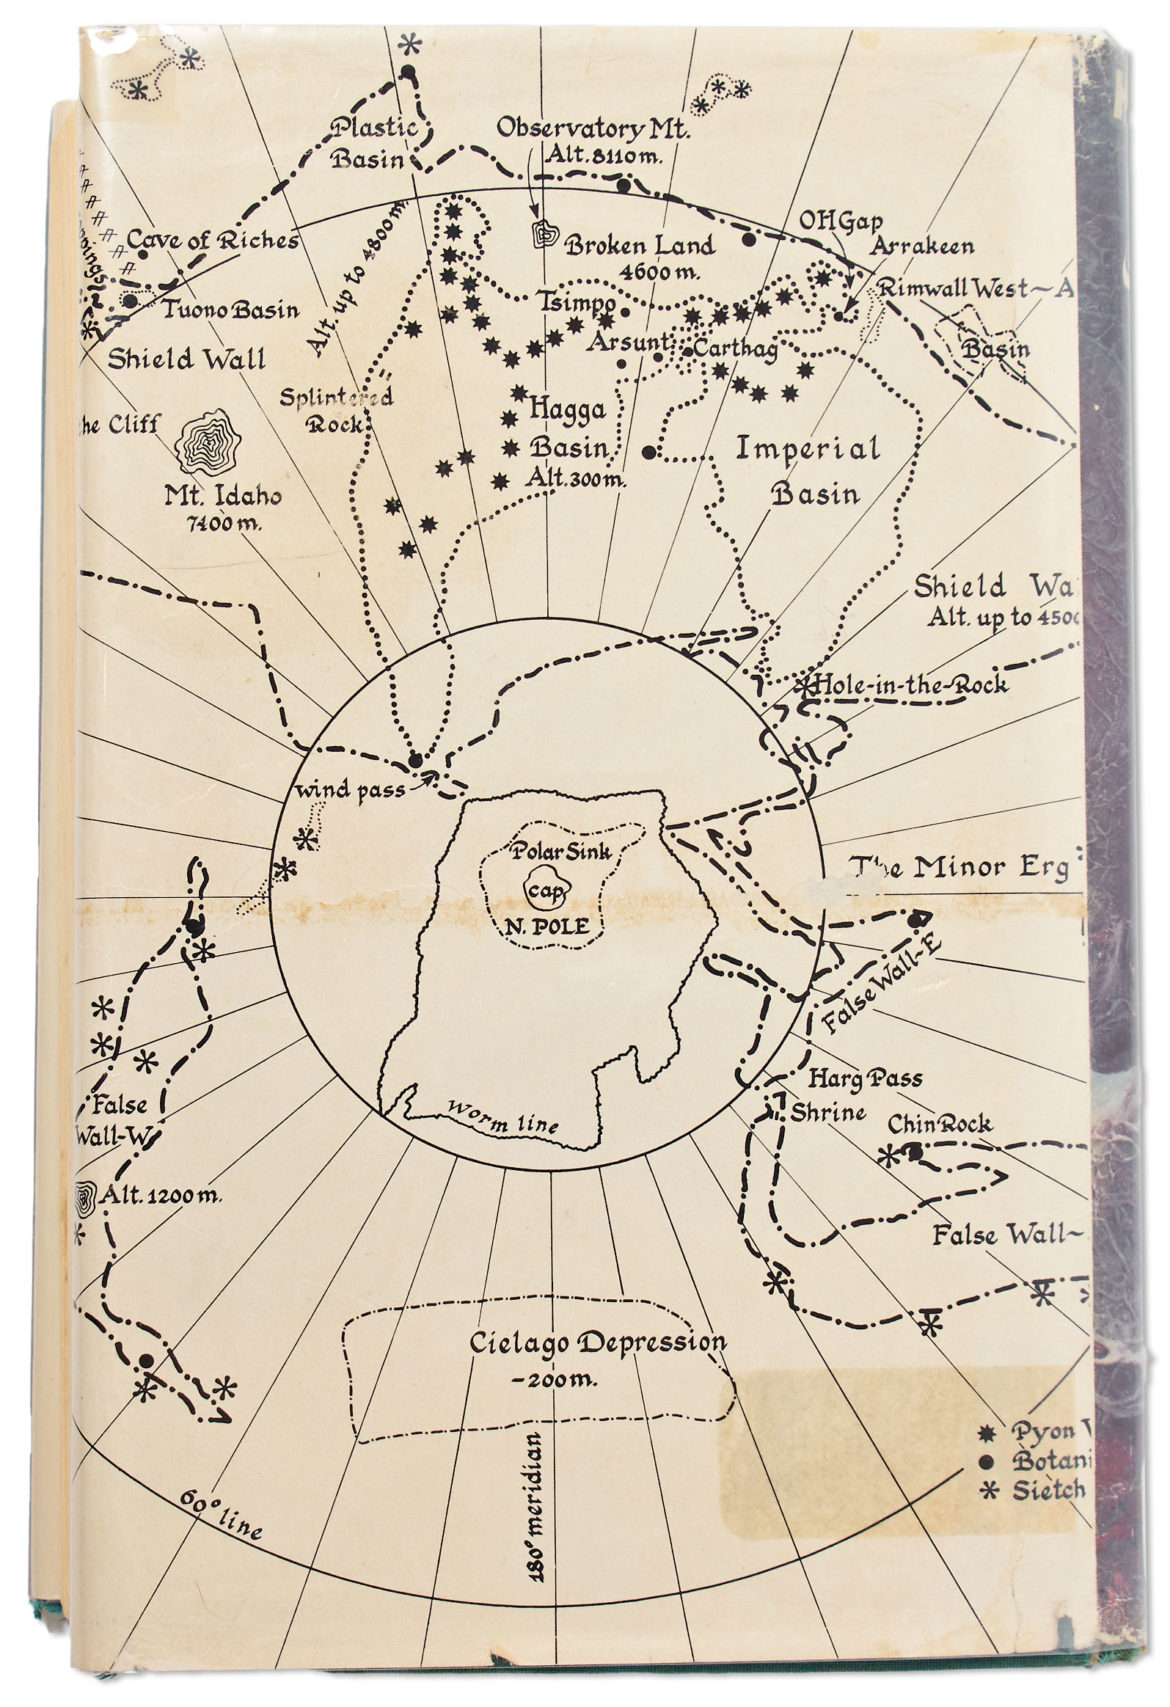
The First edition, first printing of the science fiction classic “Dune” by Frank Herbert has an unusual map of the stories setting printed on the dust jacket. The linked edition had an opening bid of $6,500 but didn’t sell. I haven’t yet read (or watched) Dune but I’m posting this here for when I do.

Dune map

ht: Nelson Minar

After posting this at reddit I was pointed toward these:

See also: The Most Accurate Maps Of Panem

Cartography Obscura

Atlas Obscura Map

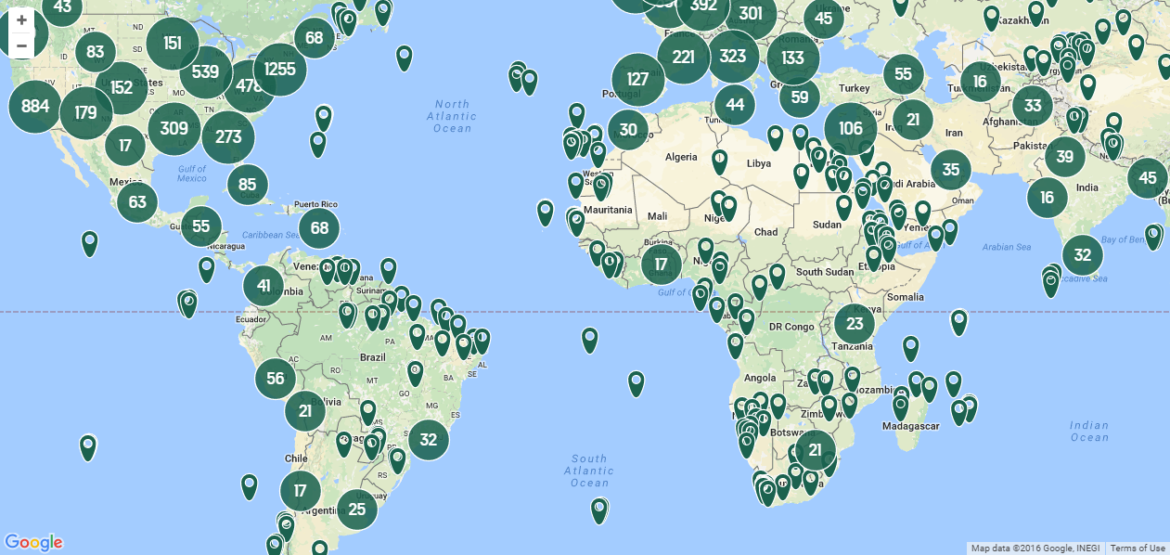
The very enjoyable Atlas Obscura website has recently hit the monolithic milestone of 10,000 listed locations. To celebrate the occasion they have created a handy map that contains all 10,000 of the world’s most obscure and extraordinary sites.

Places as far-reaching as The Lucifernum, the Tallest Filing Cabinet on Earth, the Huanglong Travertine Terraces and Bo Kaap are mapped out for your convenience.

Have fun exploring!

100,000 Stars: Interactive 3D Visualization Of Our Galaxy

100000 Stars

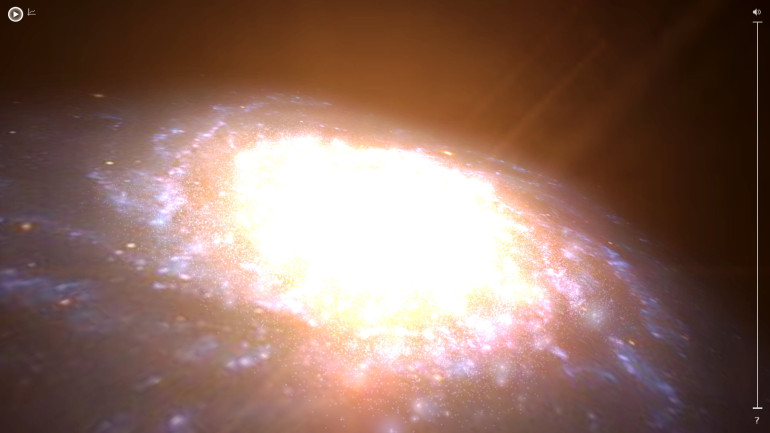
Are you ready to space out? 100,000 Stars is an interactive 3D map of our Milky Way Galaxy created by the folks over at Google. It accurately plots 100,000 local stars pulling data from a range of sources, including NASA, the European Space Agency (ESA), and the Bright Star Catalog.

100,000 Stars is an interactive visualization of the stellar neighborhood created for the Google Chrome web browser. It shows the real location of over 100,000 nearby stars. Zooming in reveals 87 individually identified stars and our solar system. The galaxy view is an artist’s rendition.

Instructions: Pan using your mouse and zoom in/out using your touchpad or mouse wheel. Click a star’s name to learn more about it.

Warning: Scientific accuracy is not guaranteed. Please do not use this visualization for interstellar navigation.

Be sure to take the tour. This is a WebGL Google Chrome Experiment, so it’ll run best on Chrome or Safari and with a decent graphics card. Damn nature, you pretty.

Mapping Earth’s Gravitational Pull

The data from the GOCE satellite reveals a potato-shaped earth defined by varying gravity. The globe seen below is a highly exaggerated rendering that neatly illustrates how the tug we feel from the mass of rock under our feet is not the same in every location. In fact, it varies widely. In this model gravity is strongest in yellow areas; it is weakest in blue ones.

The BBC says,

Technically speaking, the model is what researchers refer to as a geoid. It is not the easiest of concepts to grasp, but essentially it describes the “level” surface on an idealised world.

It is the shape the oceans would adopt if there were no winds, no currents and no tides. The differences have been magnified nearly 10,000 times to show up as they do in the new model.

Even so, a boat off the coast of Europe (bright yellow) can sit 180m “higher” than a boat in the middle of the Indian Ocean (deep blue) and still be on the same level plane. This is the trick gravity plays on Earth because the space rock on which we live is not a perfect sphere and its interior mass is not evenly distributed.

Postcards From Google Earth

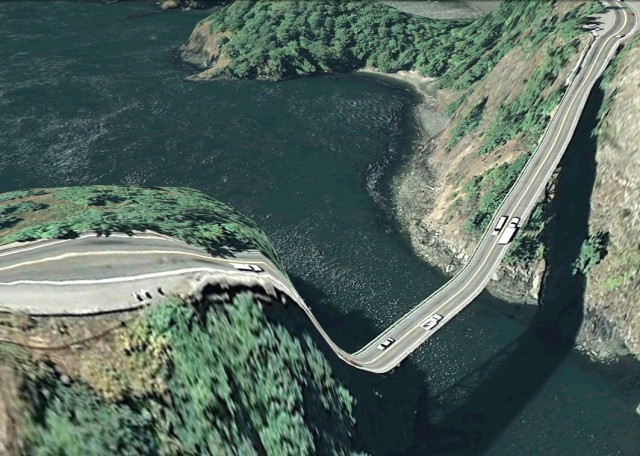
Deception Pass

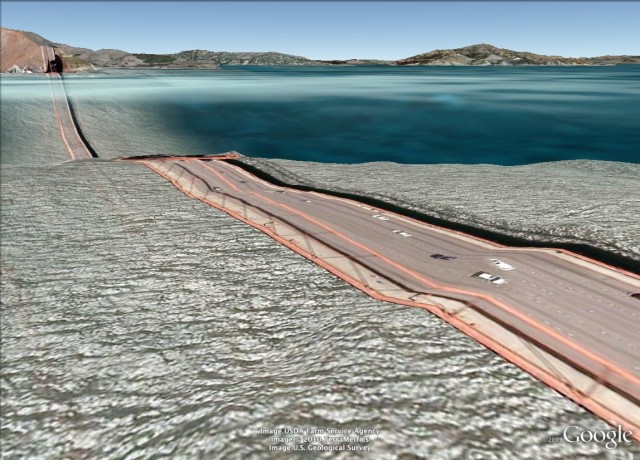
Golden Gate

Brooklyn-based architect and designer Clement Valla is the creator of “Bridges” a screenshot collection made from bridges and roads from Google Earth. The collection concentrates on capturing Google Earth’s alogrithmic mishaps in elevation. The screen caps show surreal landscapes of twisted 3D & 2D aesthetics where stringy bridges slouch across caved in canyons and highway seem to melt with gravity.

The images are screenshots from Google Earth with basic color adjustments and cropping. I am collecting these new typologies as a means of conservation – as Google Earth improves its 3D models, its terrain, and its satellite imagery, these strange, surrealist depictions of our built environment and its relation to the natural landscape will disappear in favor of better illusionistic imagery. However, I think these strange mappings of the 2-dimensional and the 3-dimensional provide us with fabulous forms that are purely the result of algorithmic processes and not of human aesthetic decision making. They are artifacts worth preserving.

Maps Of City Skylines

New York City Skyline Map
Map courtesy of Andy Woodruff

A few weeks ago, Eric Fischer put together a set of maps that attempted to compare the areas of a city that were most often photographed by locals versus the areas most often photographed by tourists. A look through the maps of 60 different cities shows concentrations of web-posted tourist pictures in museums, parks, historic sites, architectural marvels, etc. Other (more) interesting areas of the city are filled in by photographs from the locals.

Another cartography tool to add to your travel-photography-belt are Andy Woodruff’s maps depicting the best areas to photograph a city’s skyline (as defined by photos tagged “skyline” on Flickr). They were put together in a sort of heat map style where brighter red and yellow marks indicate a higher density of photos (and presumably a superior view of the skyline). His blog has maps of several cities, including Boston, Seattle, Vancouver, and Chicago, among others.

Unfortunately, neither Eric’s tourists maps nor Andy’s skyline maps contain locations in Denver.

Scroll to Top